Trade Identification and portfolio-building tool for Commodity Futures
Does your trading strategy include high volume spreads fly &
complex structures in commodities – specifically crude oil futures?
Do you frequently attempt to construct ratio spreads, broken-wing
butterflies, butterflies and complex butterfly structures?
Do you attempt trades of nature that involve converting ratio spreads
and broken-wing butterflies to free butterflies?
Does your trading strategy
include high volume spreads
fly & complex structures in commodities – specifically
crude oil futures?
Do you frequently attempt to construct ratio spreads, broken-wing butterflies, butterflies and complex butterfly structures?
Do you attempt trades of nature that involve converting ratio spreads and broken-wing butterflies to free butterflies?

INTELLIGENT. COMPREHENSIVE. STREAMLINED.
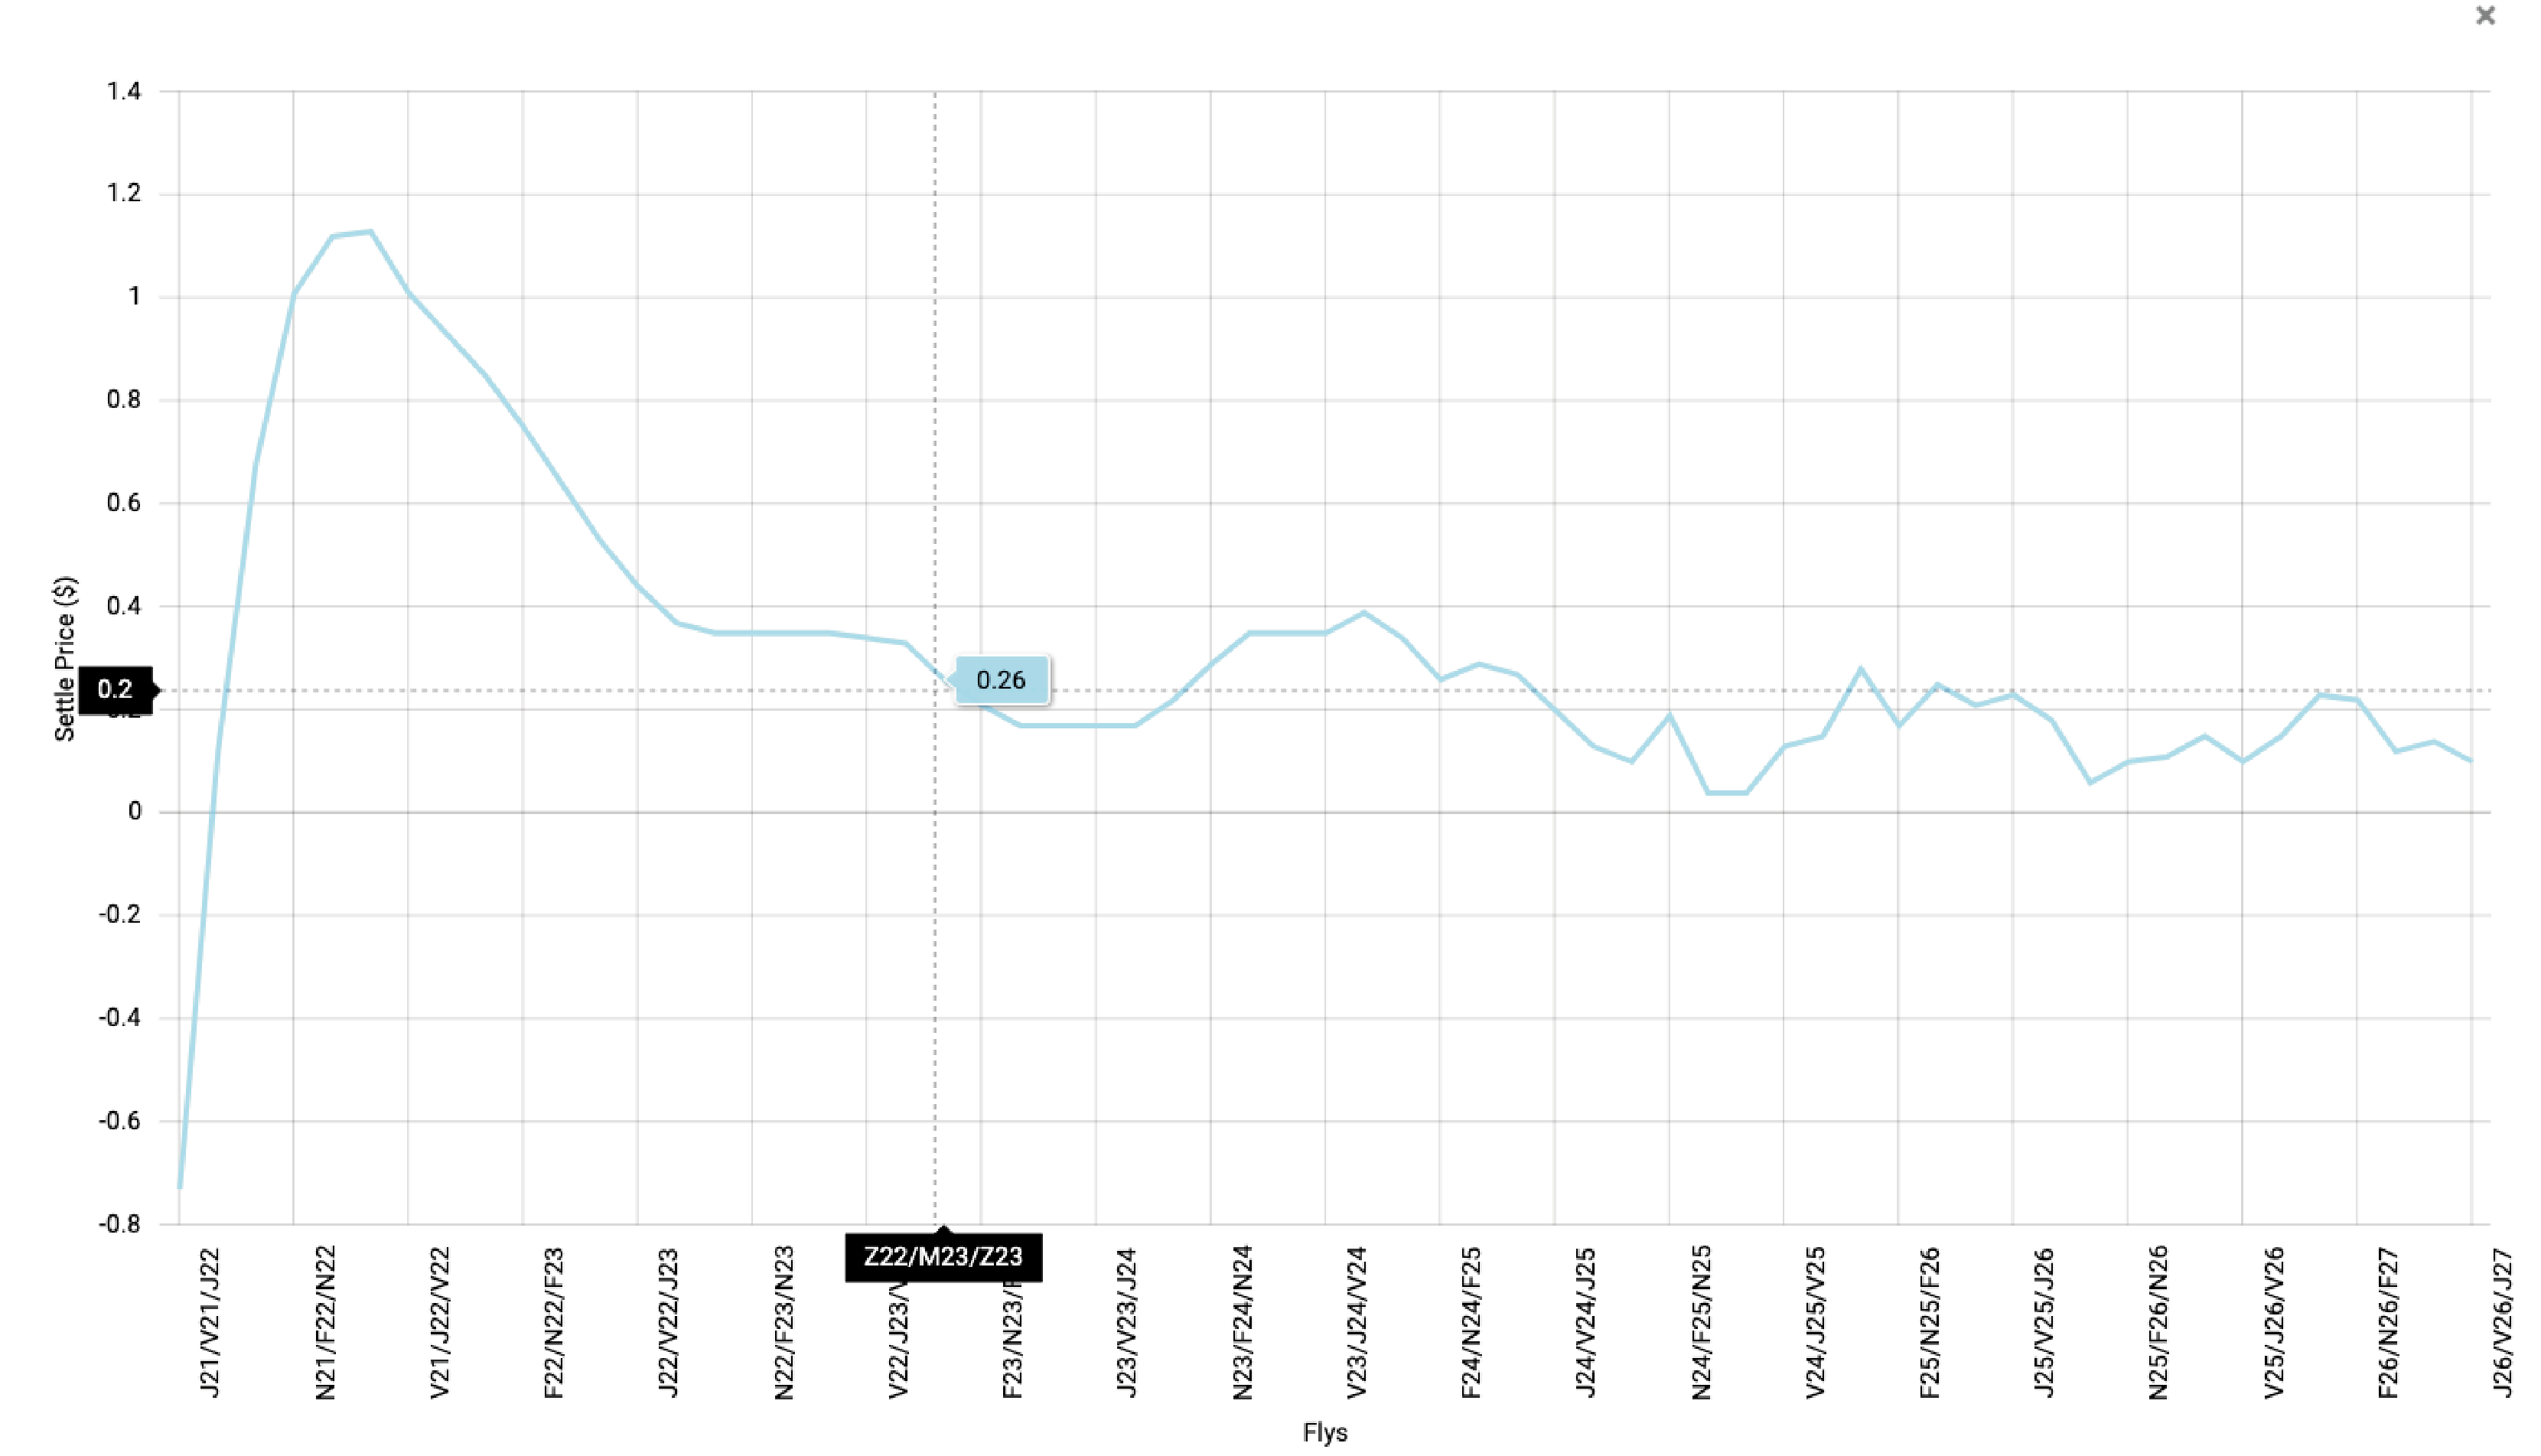
- Identify and isolate anomalies in the Futures Curve
- Utilize the anomaly to research possible opportunities on Doubleflys around that anomaly
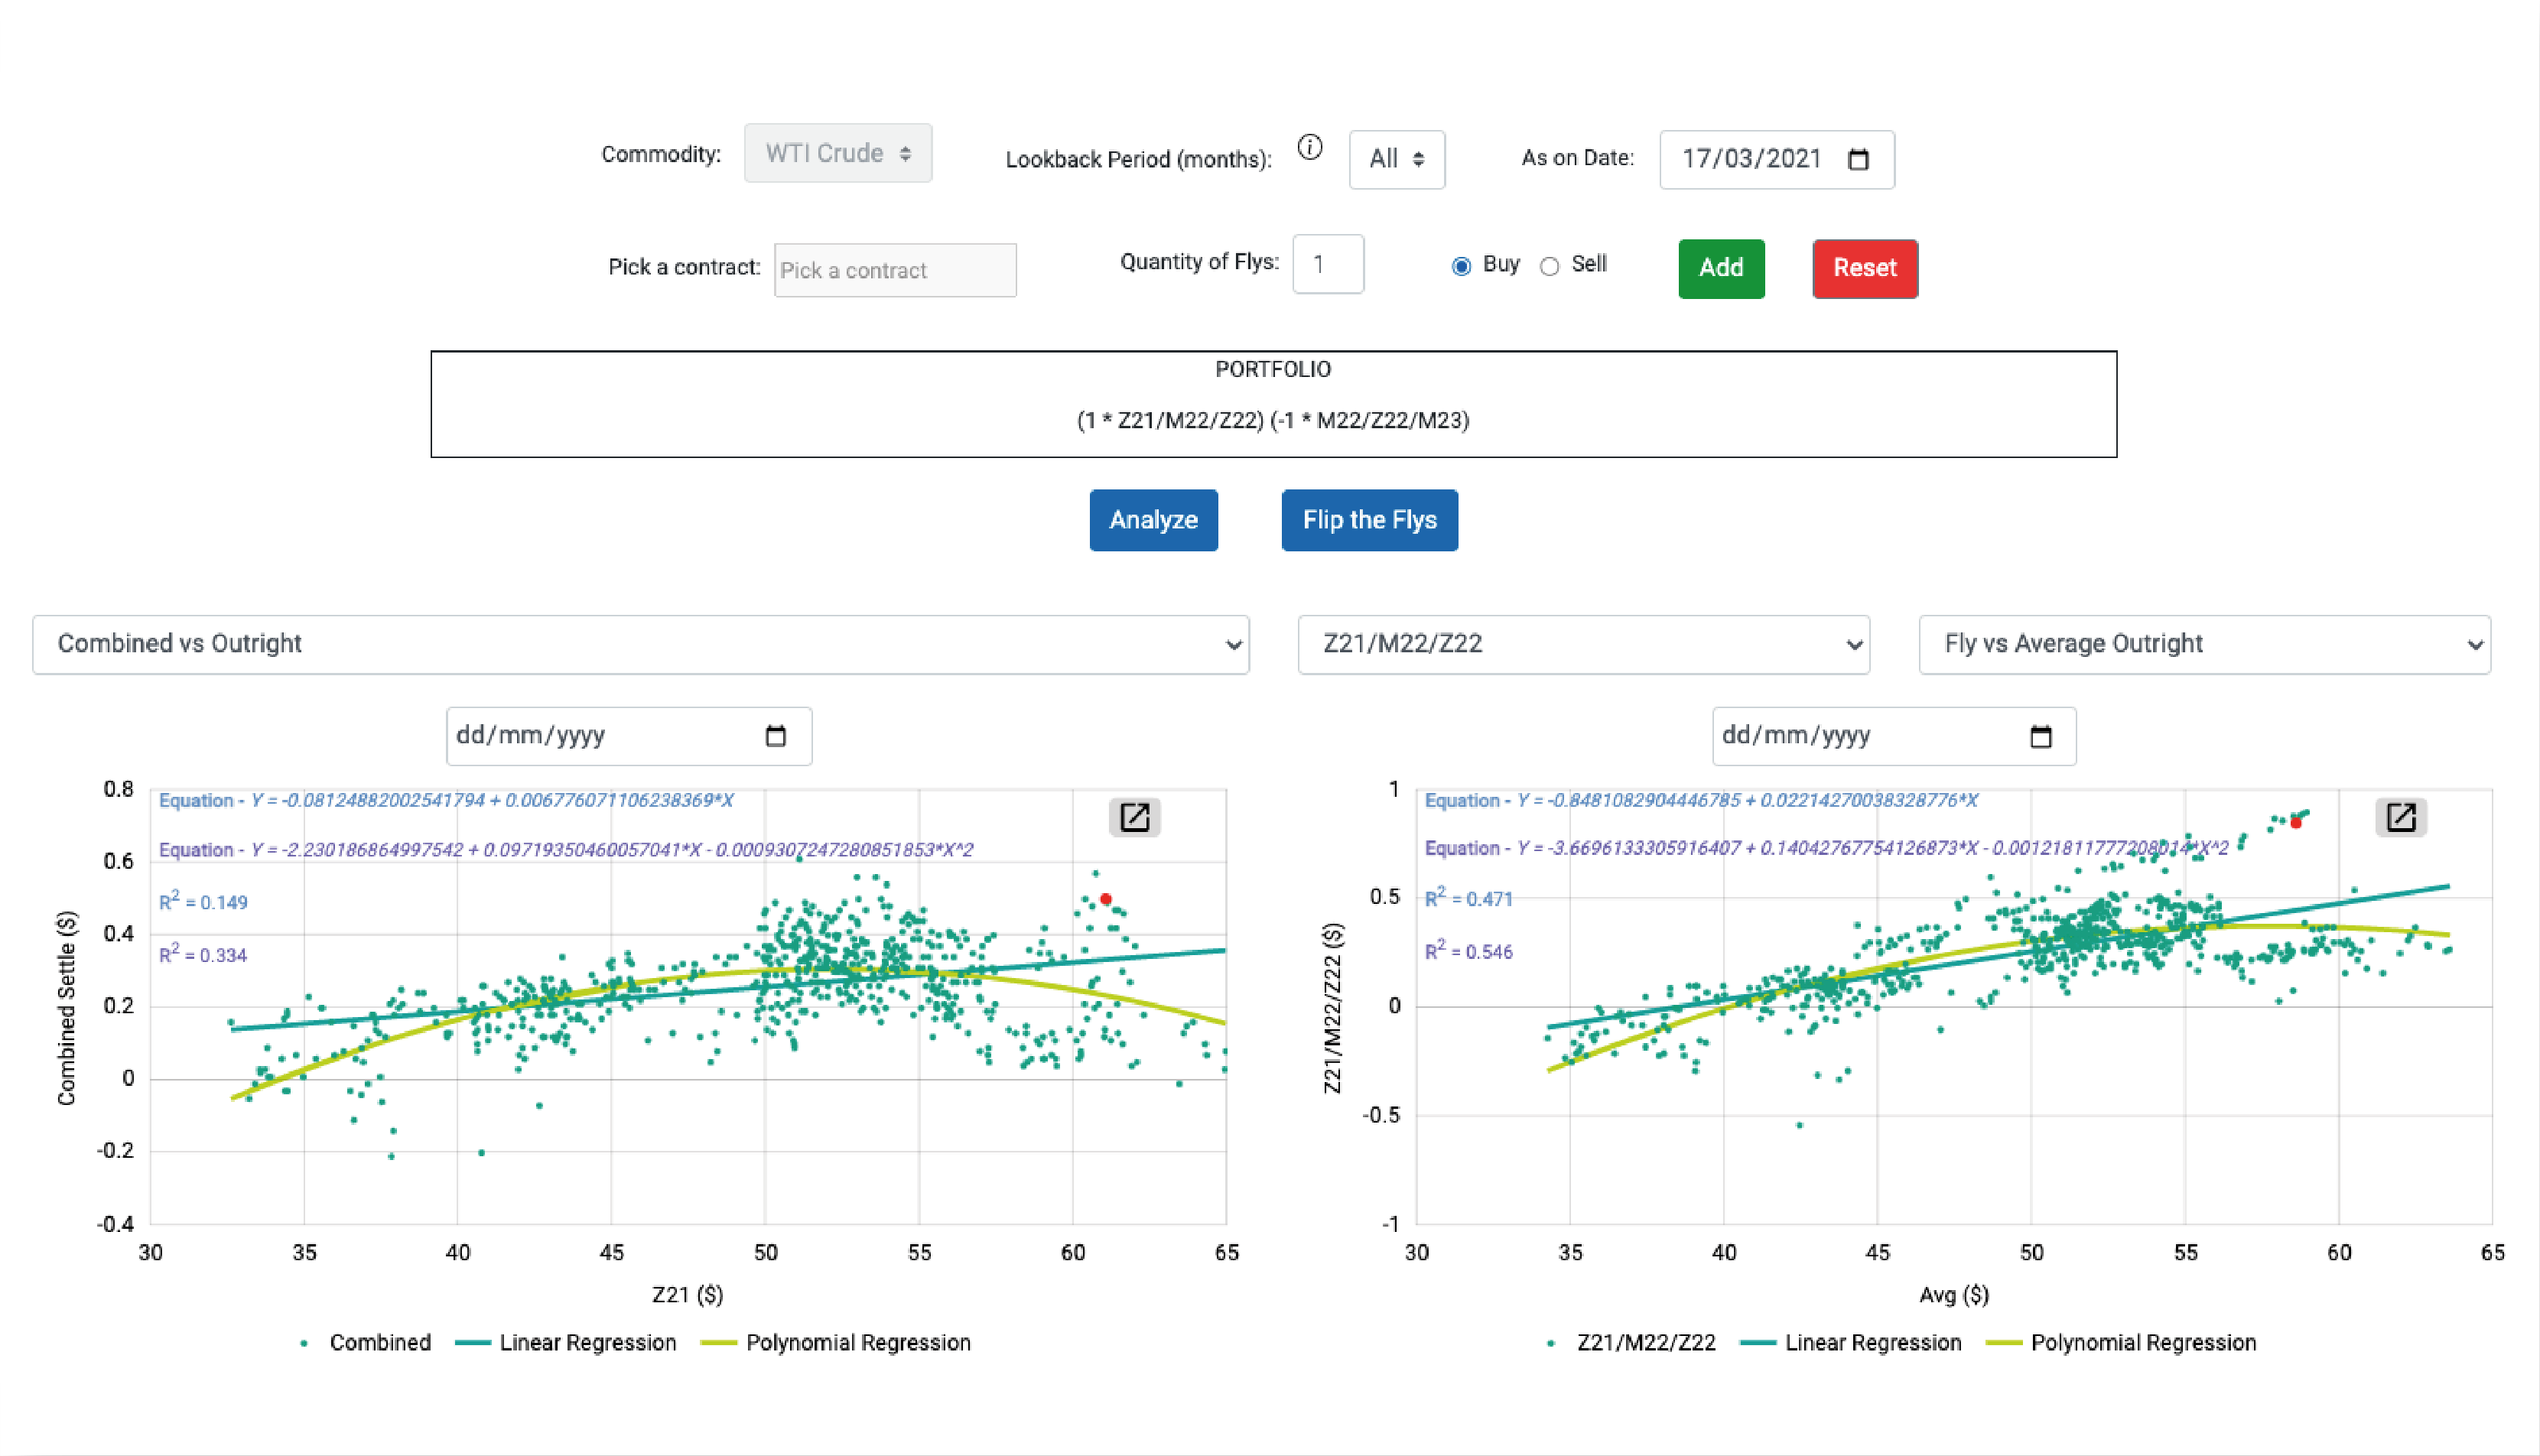
- Plot regression graphs on the combined Doublefly structure against different variables such as Outright price to visualize possible trades when the price of the structure is far away from the regression line
- Quantify “far away” by means of standard deviation and use this metric to identify other possible trades on any given day
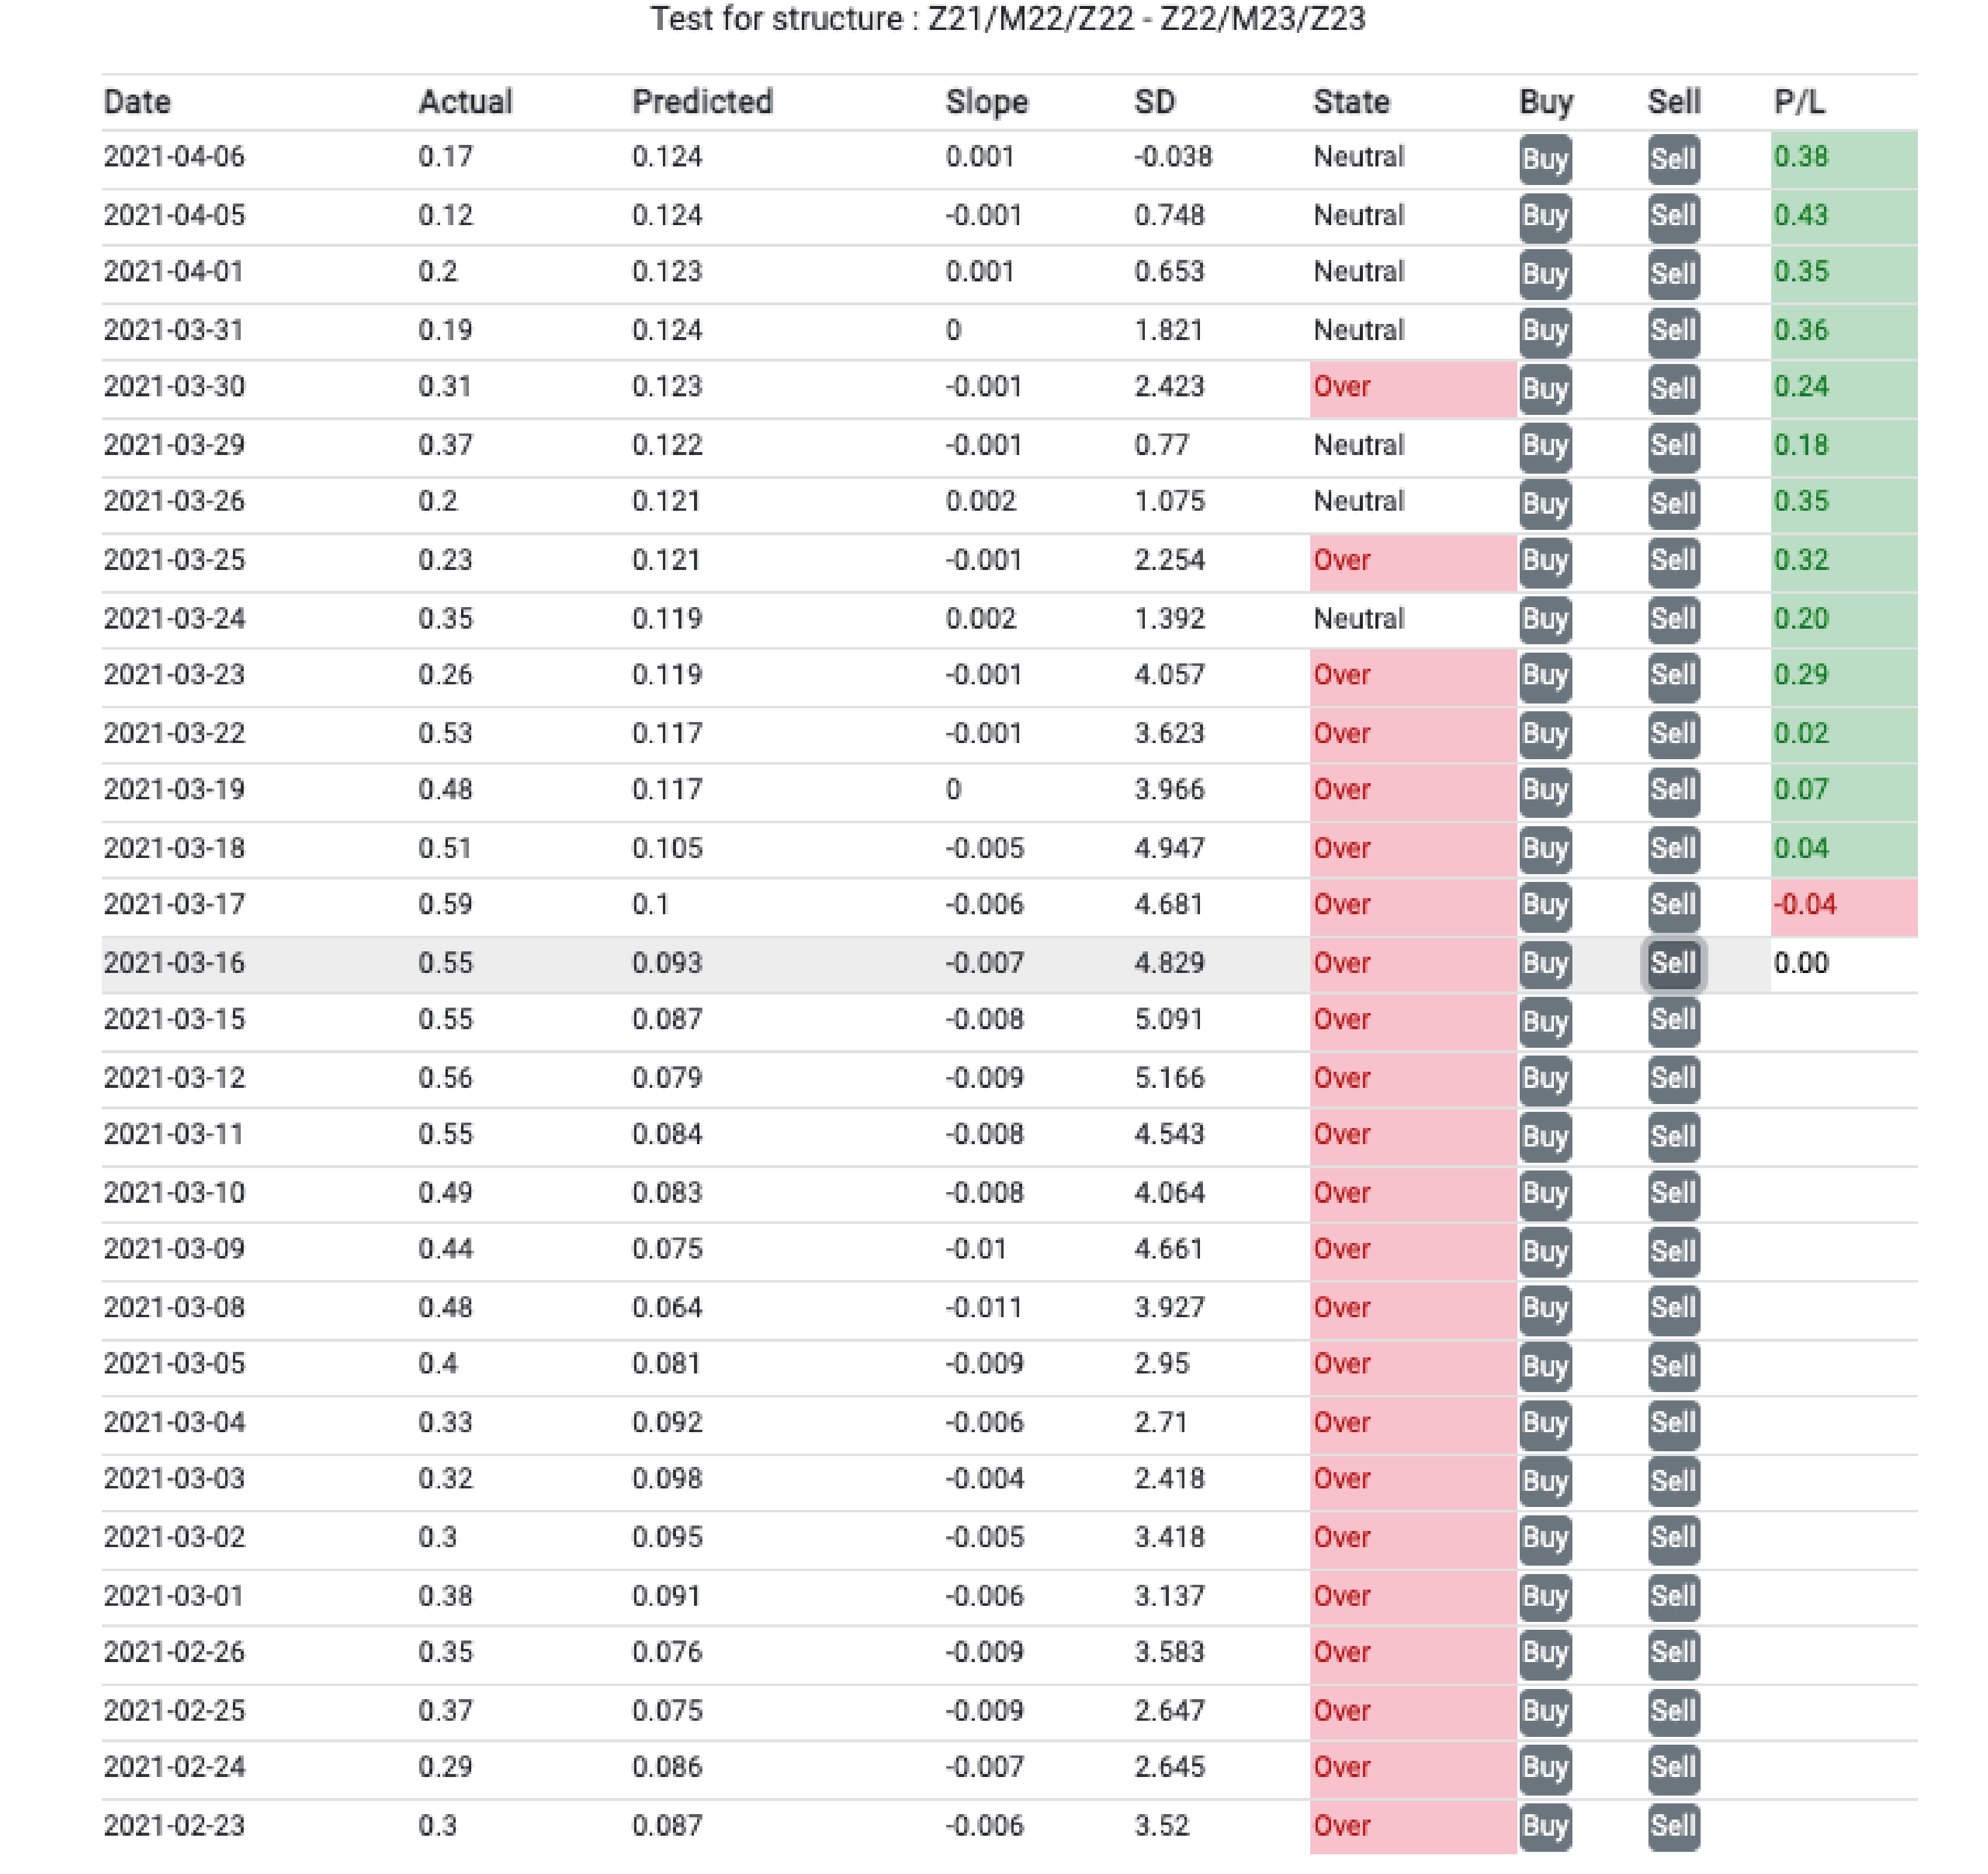
- Back test profit and loss based on a future date value to forward test how the trade would have performed
- To find the best trades, perform a thorough statistical analysis and visualize the results using various filters, such as trade duration, structure type, standard deviations, etc.

Click to enlarge
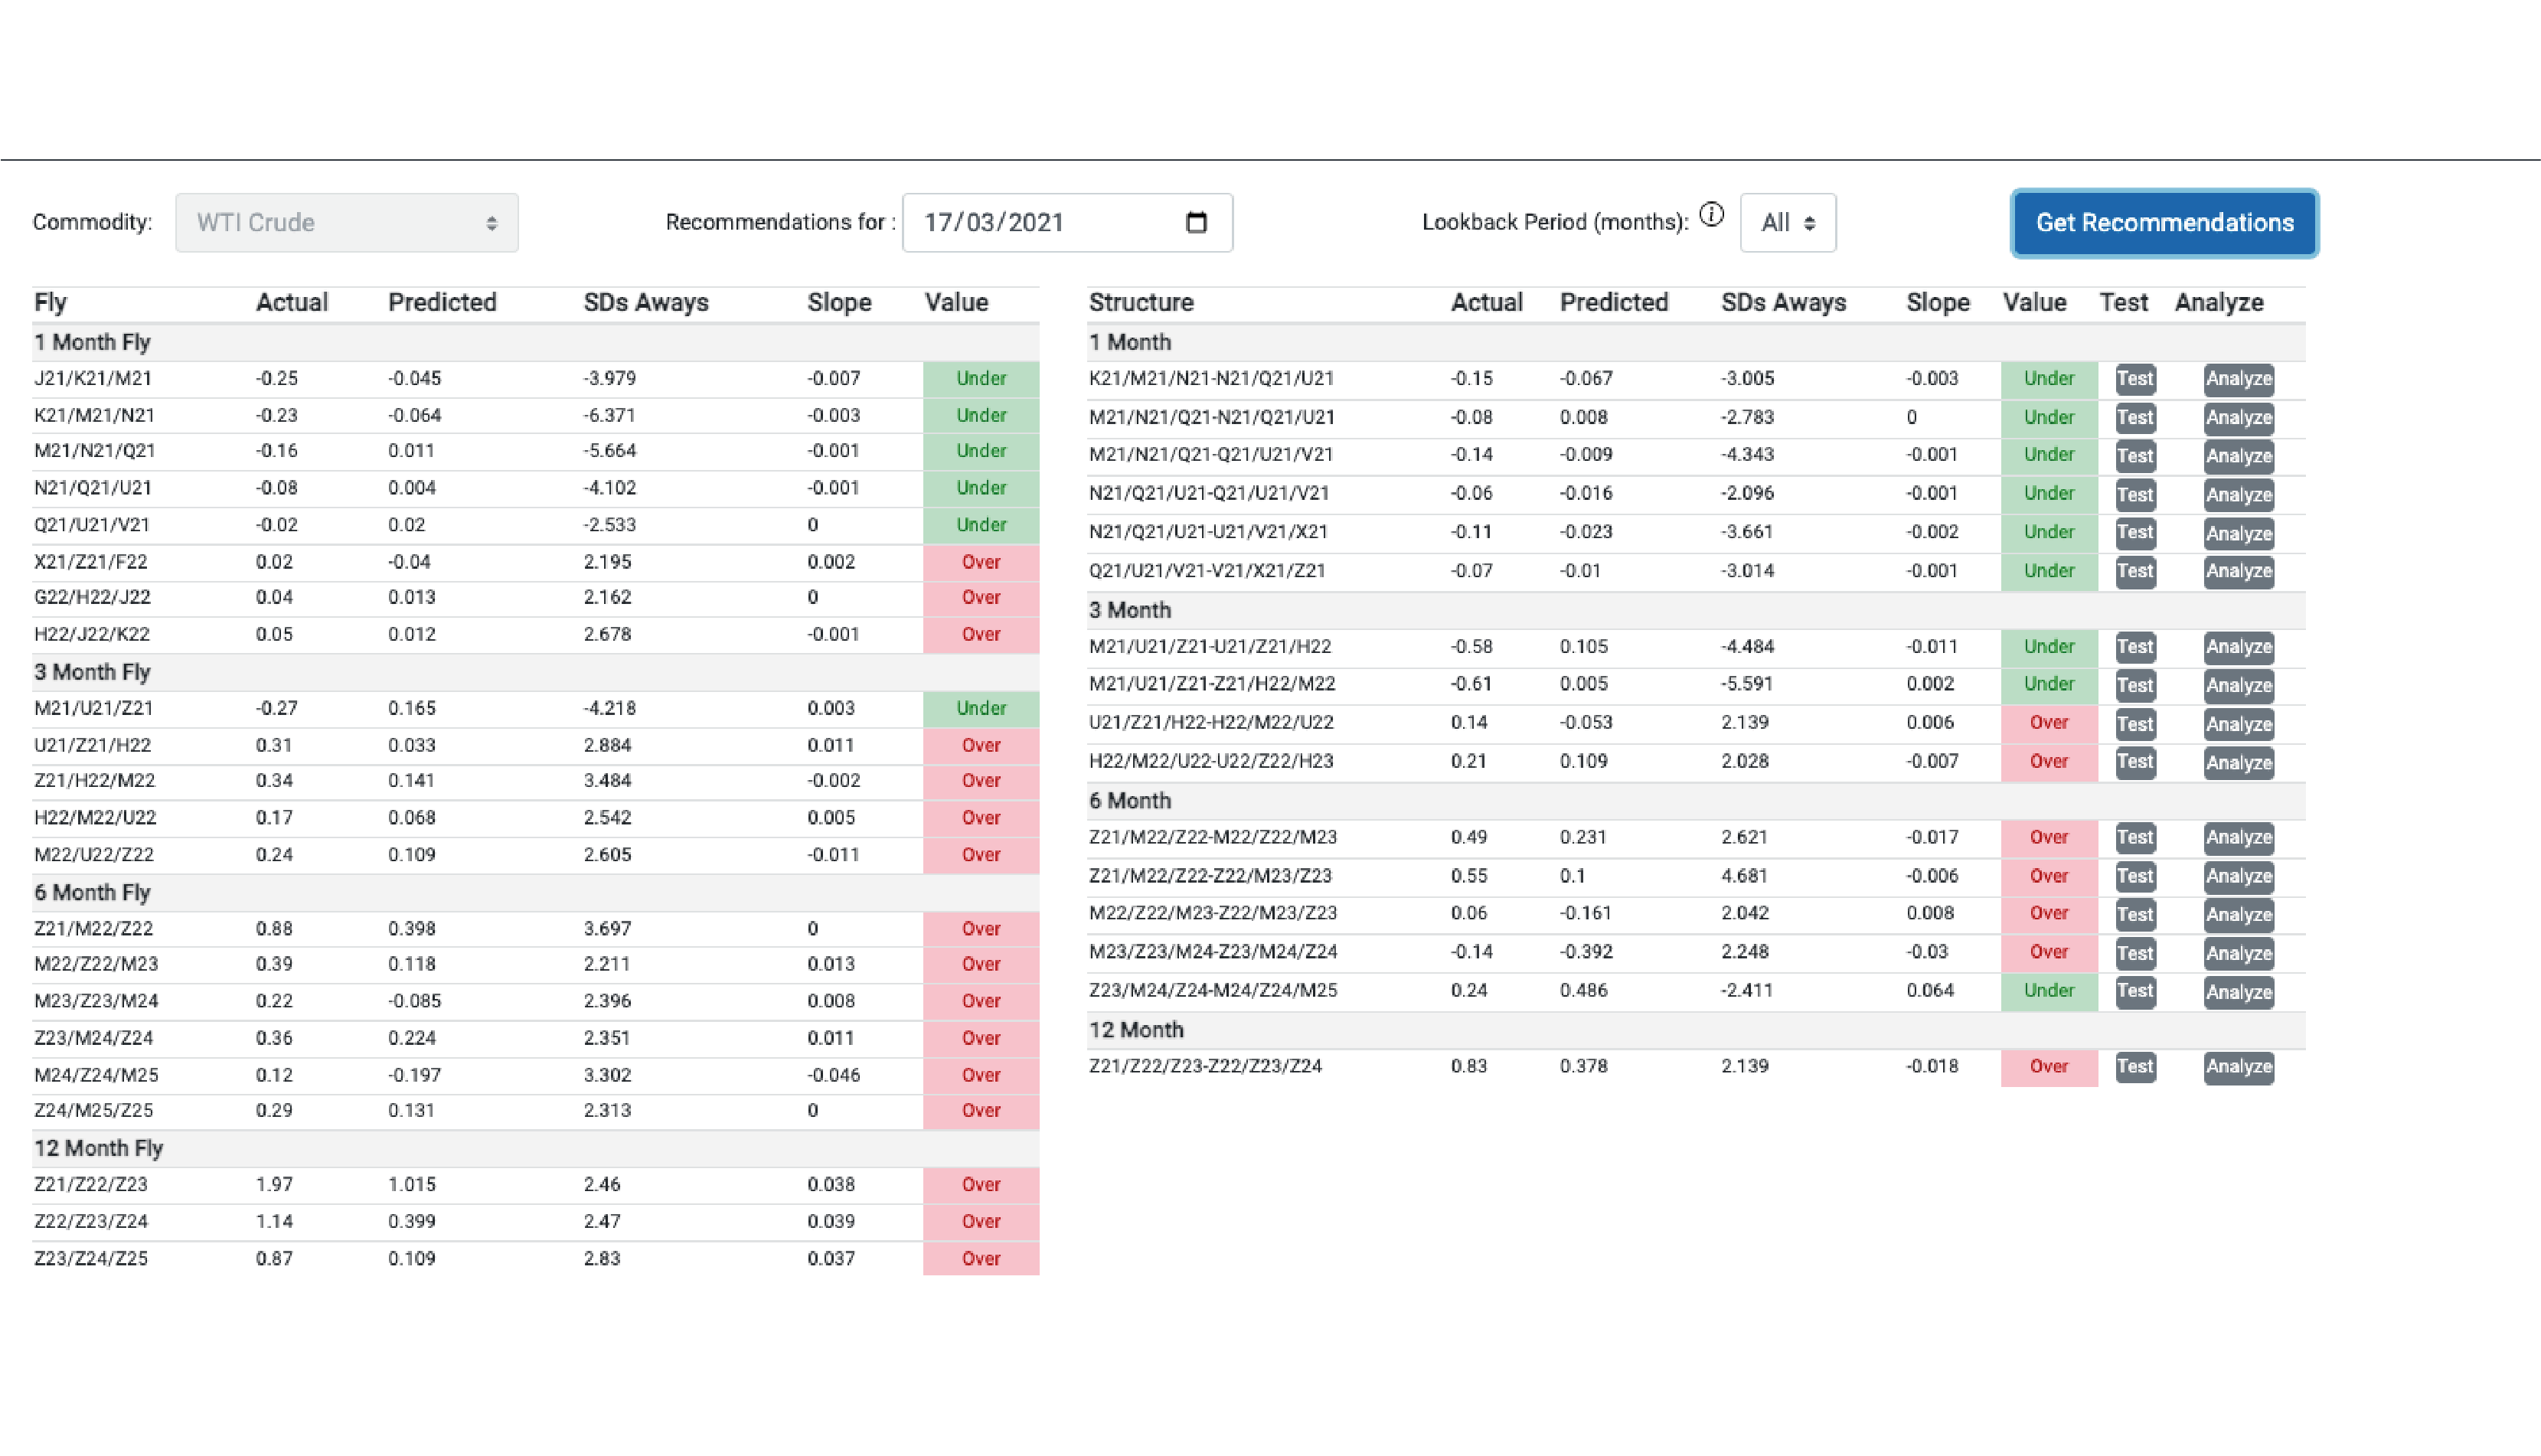
Recommendations tab as on 10th June 2021 for WTI rude Oil
Recommendations tab also automates the entire manual process of identifying the anomalies. Each day active combinations of structures are evaluated by the platform to provide suitable recommendations.
Structures with the best opportunities are indicated based on a threshold Standard Deviation (SD). Based on the SD, type of trade is recommended i.e., Undervalued implies a LONG and Overvalued implies a SHORT.

FORWARD CURVES
ANALYZE
BACK TEST
RECOMMENDATIONS
Inter-Commodity: Brent vs Crude
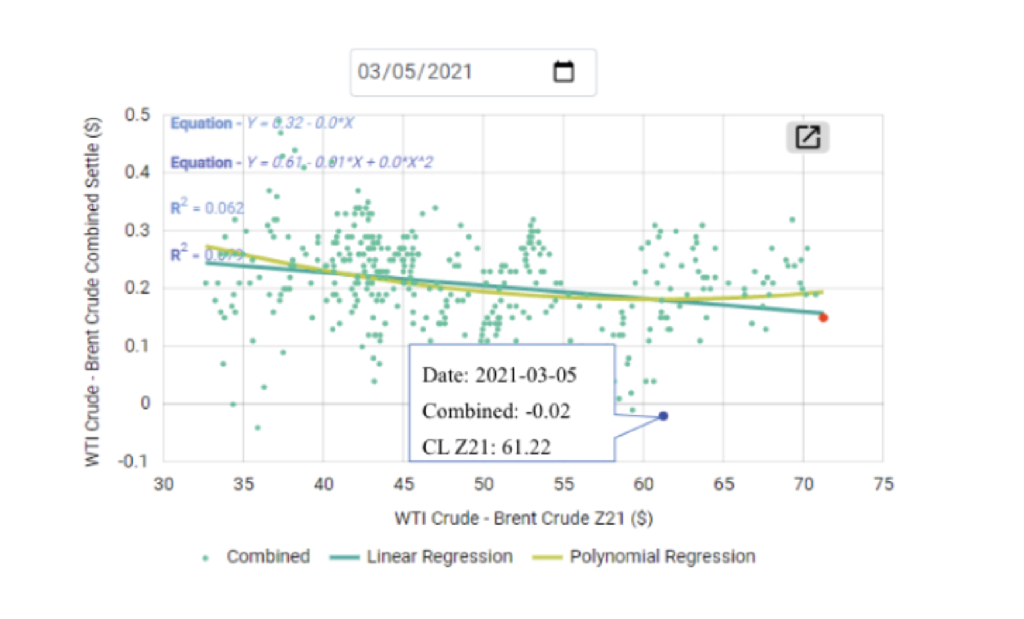
We notice an anomaly on March 5th,2021 (blue dot) for the doublefly structure below (WTI) Z21/M22/Z22.
Since, 5th March datav point is below the Regression Lines, it is undervalued, and a Long position is recommended on the structure.
Exiting on July 1st,2021 (red dot) would have yielded a profit of $170.
Soybean: X21/F22/H22 Doublefly
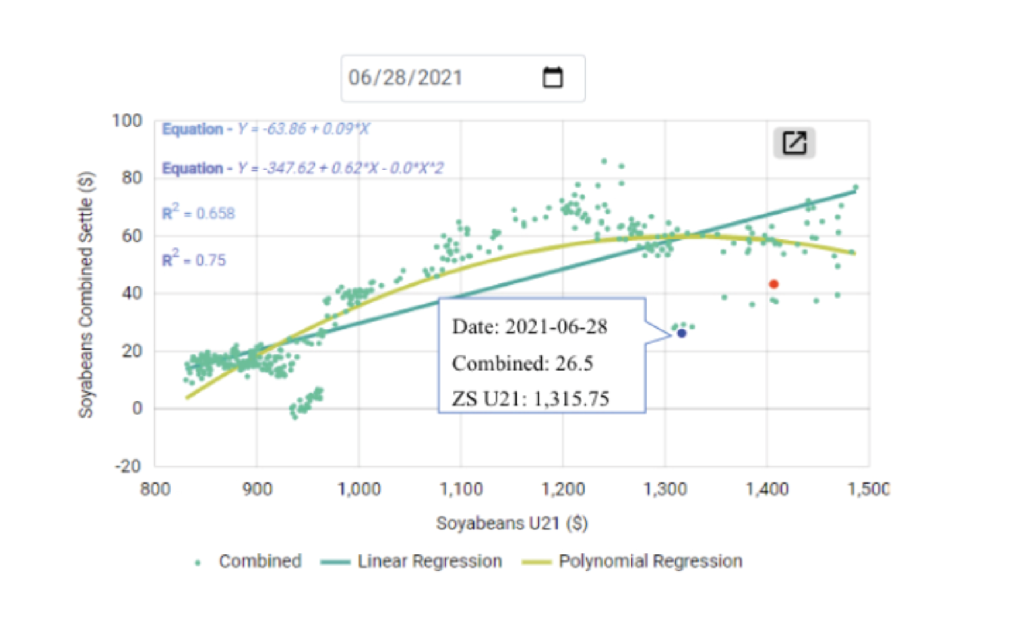
We notice an anomaly on June 28th, 2021 (as shown by blue dot) for the doublefly structure below. (U21/X21/F22-X21/F22/H22).
Since it is below the Regresssion lines, it is considered undervalued, and a long position is recommended.
Exiting on July 1st, 2021 (red dot), would have yielded a profit of $255.
What is
Future Fly?
FutureFly is a trade identification and portfolio-building tool for spreads, flys and complex structures in commodity futures. FutureFly has been developed keeping in mind the needs of crude oil traders but is easily customisable and adaptable to any commodity futures.
Why Future Fly
You can analyse, backtest, indulge in what-if analysis, visualise and identify potential trade opportunities.


